

The Canadian travel and tourism industry is one of the country’s most significant economic engines, generating over $130 billion in direct visitor spending annually and supporting more than 700,000 jobs. Whether you are a travel professional, industry researcher, journalist, or curious traveller, this page compiles the most current statistics on Canada’s tourism sector, the cruise industry, Caribbean travel trends, and Ontario’s travel consumer protection framework.
All figures are sourced from official government data (Statistics Canada, Destination Canada), industry bodies (CLIA, TICO), and recognized market research firms.
Canada Tourism Industry Overview
Market Size and Economic Impact
Direct Visitor Spending
Destination Canada, 2024
Total Economic Footprint
Direct + indirect + induced
Tourism Jobs
Statistics Canada, Q2 2025
Government Tax Revenue
Statistics Canada, 2024
Canada’s travel and tourism market was valued at approximately US$94.7 billion in 2025, with projections reaching US$120.2 billion by 2031 at a compound annual growth rate (CAGR) of 4.06%. Tourism is Canada’s second-largest service export, injecting $31.2 billion in new export dollars from international visitors in 2024.
| Metric | Value | Period | Source |
|---|---|---|---|
| Direct visitor spending | $130 billion | 2024 | Destination Canada |
| Total economic footprint | $263 billion | 2024 | Destination Canada |
| Total tourism spending | $129.6 billion | 2024 | Canadian Tourism Data Collective |
| Summer tourism revenue (May-Aug) | $58.96 billion (record) | 2025 | Destination Canada |
| Government revenue from tourism | $32.7 billion | 2024 | Statistics Canada |
| Tourism share of GDP | 1.77% | Q2 2025 | Statistics Canada |
| Projected market size (2031) | US$120.2 billion | Forecast | Mordor Intelligence |
| Projected annual revenue (2029) | $160 billion | Forecast | Destination Canada |
For every $100 spent on tourism in Canada, $25.21 flows to federal, provincial, and municipal governments through taxes and related revenue — more per dollar than many other economic sectors.
Employment
Tourism supports 712,100 jobs across Canada (Q2 2025), representing 3.34% of economy-wide employment. When indirect and induced effects are included, approximately 1 in 10 Canadian jobs relies on tourism-related economic activity across 265,800 businesses in more than 5,000 communities.
| Employment Metric | Value | Period | Source |
|---|---|---|---|
| Direct tourism jobs | 712,100 | Q2 2025 | Statistics Canada |
| Share of economy-wide jobs | 3.34% | Q2 2025 | Statistics Canada |
| Tourism businesses supported | 265,800 | 2024 | Destination Canada |
| Communities with tourism activity | 5,000+ | 2024 | Destination Canada |
Domestic vs. International Travel
Domestic residents account for 76% of Canada’s tourism market volume. However, international arrivals are the fastest-growing segment, projected to grow at 5.13% CAGR through 2031. In Q2 2025, domestic tourism spending rose 2.9% as Canadians chose to travel within Canada rather than to the United States, where overnight trips by Canadians declined 13%.
Summer 2025 was a record-breaking season: domestic tourism revenue reached $44.37 billion (up 6.9% year-over-year), while international revenue hit $14.59 billion (up 3.1%). National hotel occupancy reached 80.7% in August 2025 — the highest since 2014 — and 89% of Canadian regions posted year-over-year tourism growth.
Market Segmentation
| Segment | Market Share (2025) | Fastest Growing |
|---|---|---|
| By Type: Holiday/Leisure | 45.27% | Adventure & Eco-Tourism (5.37% CAGR) |
| By Service: Transportation | 42.63% | Recreation/Entertainment (5.10% CAGR) |
| By Province: Ontario | 43.40% | British Columbia (5.17% CAGR) |
| By Channel: Online Travel Agencies | 42.95% | OTAs growing at 5.01% CAGR |
Traditional travel agencies maintain a significant role in complex itineraries — cruise vacations, destination weddings, corporate incentive travel, and group travel — where personalised service, duty-of-care obligations, and negotiated supplier rates provide value that self-service platforms cannot replicate.
Cruise Industry Statistics
Global Cruise Market
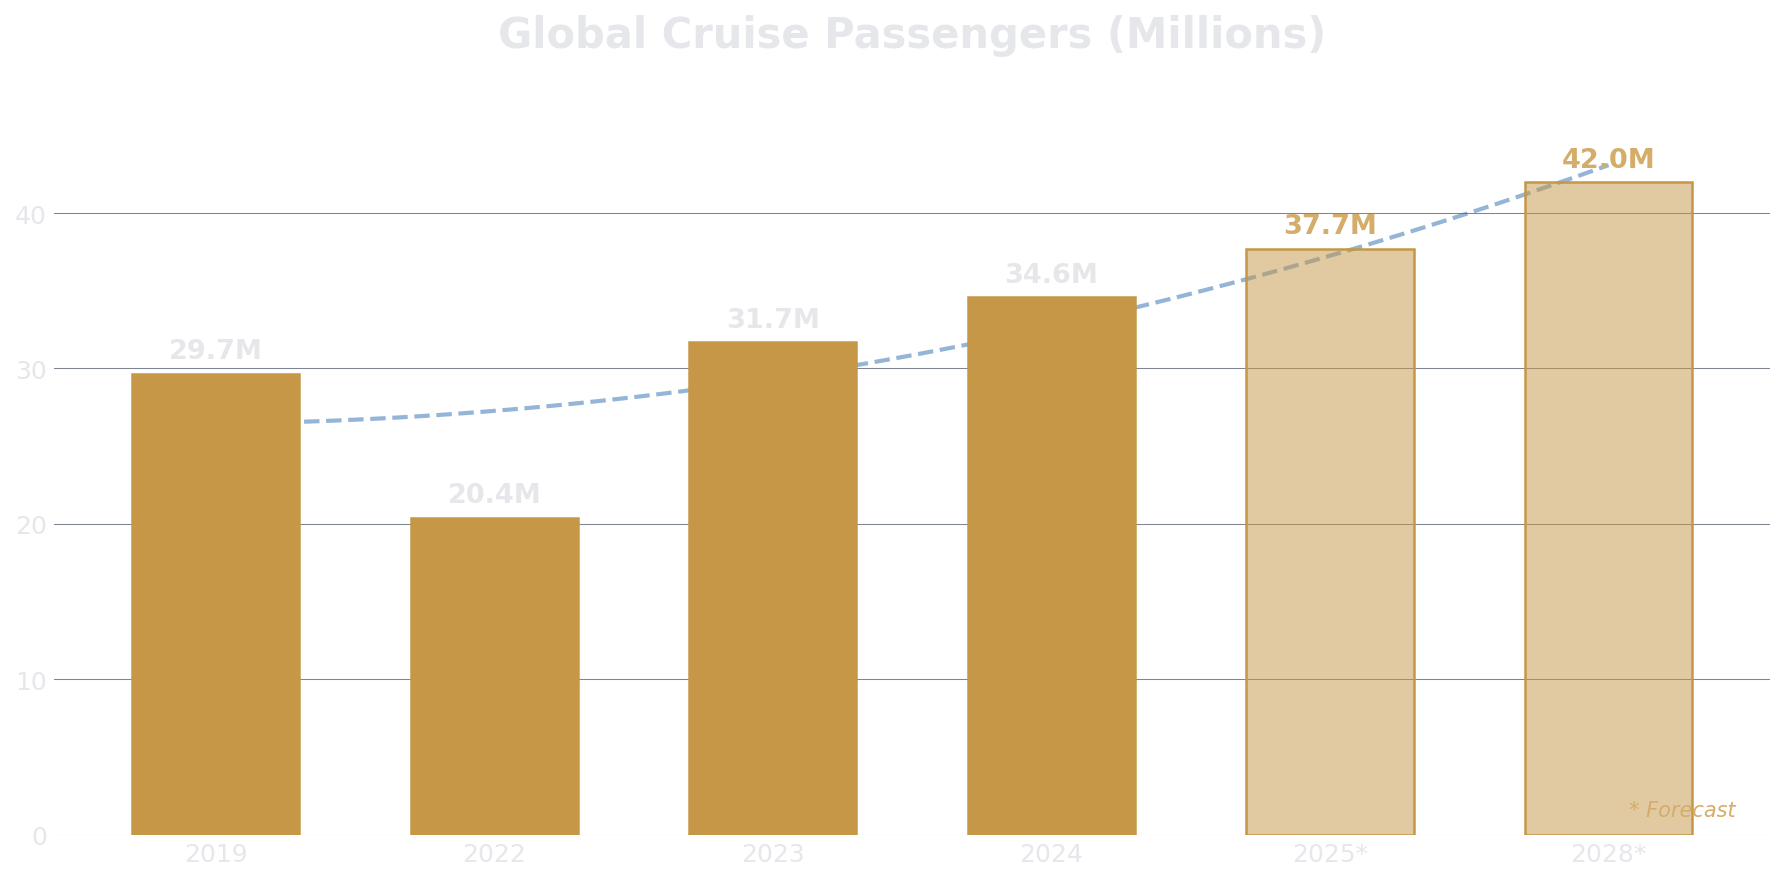
The global cruise industry reached record levels in 2024, with 34.6 million ocean-going passengers — a 9.3% increase over 2023 and 16.8% above pre-pandemic 2019 levels. The industry is forecast to reach 37.7 million passengers in 2025 and 42 million by 2028.
Source: Cruise Lines International Association (CLIA), State of the Cruise Industry Reports 2024 & 2025
| Year | Global Passengers | Change vs Prior | Source |
|---|---|---|---|
| 2019 (pre-pandemic) | 29.67 million | — | CLIA |
| 2022 | 20.4 million | Recovery year | CLIA |
| 2023 | 31.7 million | 107% of 2019 | CLIA |
| 2024 | 34.6 million | +9.3% | CLIA |
| 2025 (forecast) | 37.7 million | +9.0% | CLIA |
| 2028 (forecast) | 42 million | — | CLIA |
Despite record growth, cruising still represents only 2.7% of the international travel and tourism sector — a massive runway for continued expansion.
Cruise Economic Impact (2023 — Latest Full Year)
| Region | Economic Impact | Jobs Supported | Passengers | Wages |
|---|---|---|---|---|
| Global | $168.6B (USD) | 1.6 million | 31.7M | $56.9B (USD) |
| United States | $65.4B (USD) | 290,000 | 16.9M | $25.3B (USD) |
| Europe | EUR 55.3B | 440,000 | 8.2M | EUR 16.8B |
| Canada | CA$5.2B | 24,000 | 1.03M | CA$1.3B |
More than 75% of cruise industry jobs are generated onshore — at ports, in local tourism businesses, and through supply chains. One job is supported for every 20 cruise passengers globally.
Canada’s Cruise Industry
Canadian Cruise Passengers
CLIA, 2023
Economic Impact
CLIA, 2023
Jobs Supported
CLIA, 2023
Vancouver Port Passengers
VFPA, 2025
The Port of Vancouver — named “North America’s Leading Cruise Port” by World Travel Awards in 2025 — welcomed 1.2 million passengers across 301 ship visits, with each call injecting approximately $3 million into the local economy.
Canadian cruise passengers spend an average of $450 per person on hotels, restaurants, shopping, tours, and local attractions at port cities. With 69% of passengers booking at least one hotel night pre- or post-cruise, the economic benefit extends well beyond the port terminal.
For Canadians exploring cruise deals, popular departure points include Vancouver (Alaska), Montreal and Quebec City (New England/Canada), and Toronto/Montreal connecting to Caribbean cruise itineraries via fly-cruise packages from Toronto and other Canadian cities.
Regional Cruise Passenger Volumes (2024)
| Region | 2024 Passengers | vs 2023 | vs 2019 |
|---|---|---|---|
| North America | 20.53 million | +13.4% | +17.5% |
| Europe | 8.44 million | +2.8% | +6.5% |
| Asia & Oceania | 4.03 million | +9.8% | -20.8% |
| South America | 1.17 million | +7.8% | +3.8% |
Cruise Traveller Demographics
- Average age: 46.5 years (36% under 40; 67% Gen-X or younger)
- Repeat rate: 82% of those who have cruised will cruise again
- New cruisers: 31% of 2024 passengers were first-time cruisers (up from 24% in 2019)
- Solo travellers: 12% cruised solo in 2024 (doubled from 6% in 2023); 13% of Canadian port departures are solo
- Average cruise length: 7.1 days
- Multi-cruisers: 25% of repeat cruisers sail 2+ times per year
- Destination loyalty: 6 in 10 cruisers return to a destination they first visited by cruise
Fleet and Investment
The global cruise fleet reached 310 ocean-going vessels in 2025, exceeding 650,000 lower berths for the first time. The CLIA member orderbook through 2036 comprises 56 ships representing $56.7 billion in investment — a 27% increase in capacity.
The luxury cruise segment has more than tripled since 2010 (28 ships to 97 ships), while expedition cruising grew 22% in passenger volume from 2023 to 2024. By 2028, an estimated 1.5 million travellers will choose luxury cruises annually.
Caribbean Tourism Statistics
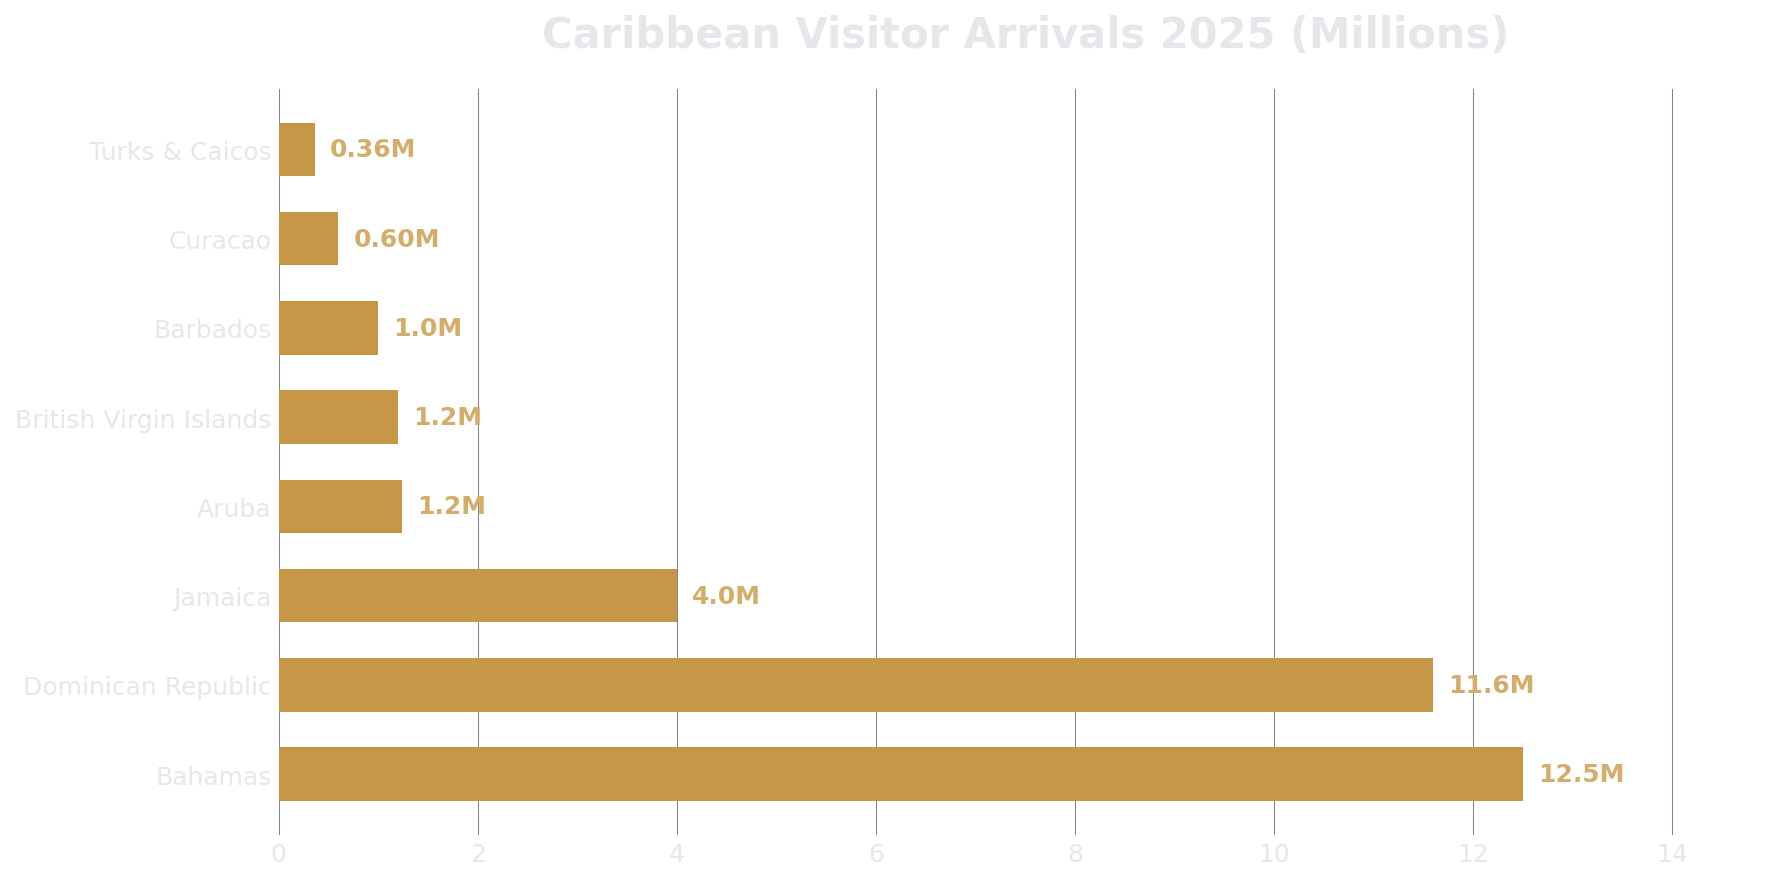
Visitor Arrivals by Destination (2025)
The Caribbean remains the world’s most visited cruise region. Individual destinations reported strong growth in 2025, though the region’s overall stayover growth was modest at 0.8% (partly due to Cuba’s significant decline).
Source: Caribbean Tourism Organization (CTO), Tourism Analytics, destination tourism boards
| Destination | Total Visitors (2025) | Year-over-Year | Cruise Passengers |
|---|---|---|---|
| Bahamas | 12.5 million | +11.4% | 10.6 million (+14%) |
| Dominican Republic | 11.6 million (record) | +2.3% stayover | — |
| Jamaica | 4+ million (record) | +13% | 1.5 million |
| Aruba | 1.24 million | +4.9% | 450,000+ |
| British Virgin Islands | 1.2 million (record) | +7% | 875,127 (record) |
| Barbados | 1+ million (record) | +9% | 600,000+ |
| Curacao | 600,000 stayover | +13% | 400,000+ |
| Turks & Caicos | 361,440 stayover | — | 1.1 million (+4%) |
| Anguilla | 229,734 | +11.2% | — |
Nassau Cruise Port processed 10.6 million cruise passengers in 2025 — a 14% increase and nearly double the 2019 figure — making it the Caribbean’s busiest cruise port.
Caribbean Tourism Revenue
- Dominican Republic: $9.5 billion in tourism revenue (2025), a 16% increase — the region’s highest-earning destination
- Aruba: Tourism revenue surpassed $2 billion for the first time in 2025
Canadian Visitors to the Caribbean
Canadian travel to the Caribbean declined nearly 8% in the first nine months of 2025, driven by a significant pullback from Cuba (-18%) and the Dominican Republic (-5.8%). This shift reflects broader Canadian consumer sentiment: a Bank of Canada survey found that 55% of Canadians planned to spend less on U.S. travel, with many redirecting toward domestic destinations or all-inclusive Caribbean resort vacations booked through Canadian travel agencies with full consumer protection.
Fastest-Growing Cruise Destinations (H1 2025)
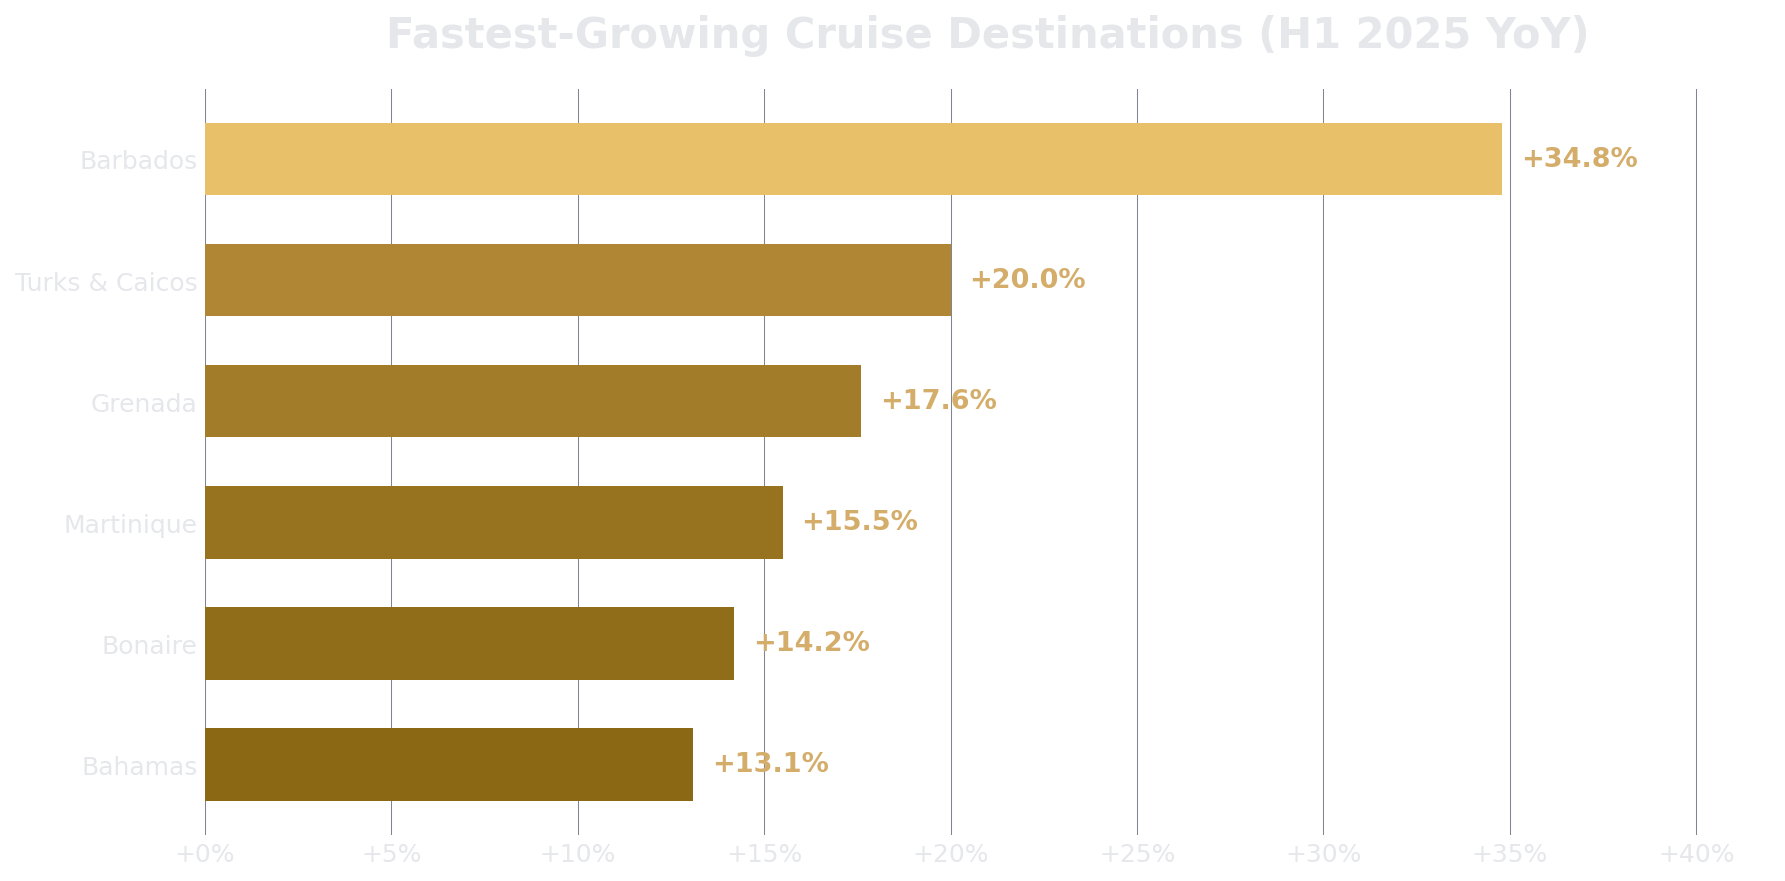
Source: Caribbean Tourism Organization, H1 2025 year-over-year cruise passenger growth
| Destination | Cruise Growth (H1 2025 YoY) |
|---|---|
| Barbados | +34.8% |
| Turks & Caicos | +20.0% |
| Grenada | +17.6% |
| Martinique | +15.5% |
| Bonaire | +14.2% |
| Bahamas | +13.1% |
TICO and Ontario Travel Consumer Protection
What Is TICO?
The Travel Industry Council of Ontario (TICO) is mandated by the Ontario government to administer the Travel Industry Act, 2002. All travel retailers and wholesalers selling travel services from Ontario must be registered with TICO. This regulatory framework provides consumer protections unavailable when booking through unregistered platforms or directly with foreign suppliers. Learn more in our Complete Guide to TICO Travel Protection.
TICO Registration Statistics (Fiscal Year 2024/2025)
Registered Agencies
TICO Annual Report
Ontario Gross Sales
TICO Annual Report
New Registrations
TICO Annual Report
Recovery vs Pre-Pandemic
TICO Annual Report
| Metric | Value | Source |
|---|---|---|
| Total TICO-registered agencies | 1,894 | TICO Annual Report 2024-2025 |
| Retail travel agencies | 1,625 (86%) | TICO Annual Report 2024-2025 |
| Travel wholesalers | 269 (14%) | TICO Annual Report 2024-2025 |
| New registrations processed | 114 | TICO Annual Report 2024-2025 |
| Ontario Gross Sales by registrants | $18 billion | TICO Annual Report 2024-2025 |
| Recovery vs pre-pandemic record | ~99% | TICO Annual Report 2024-2025 |
Ontario Travel Industry Compensation Fund
The Compensation Fund protects Ontario consumers when a TICO-registered travel agency or end supplier fails financially. It is funded by contributions from registrants based on their gross sales.
| Metric | 2024/2025 | Prior Year |
|---|---|---|
| Total Fund assets | $23,998,301 | $23,786,930 |
| Claims paid | 16 | 66 |
| Consumers assisted | 39 | 105 |
| Total paid out | $47,331 | $277,908 |
| Maximum payout per event | $5,000,000 | — |
| Maximum per person | $5,000 | — |
The declining claim numbers reflect a stabilised travel industry following the pandemic recovery period. Over the decade from 2013/14 to 2022/23, the Fund paid approximately $3.5 million in compensation across 685 claims.
Consumer Complaints and Enforcement
| Metric | 2024/2025 | Prior Year |
|---|---|---|
| Written complaints resolved | 116 | 281 |
| Restitution obtained for consumers | $121,441 | $354,534 |
| Complaints processed within 30 days | 91% | — |
| Charges laid (prosecutions) | 80 | 52 |
| Fines imposed | $99,500 | $105,925 |
| Warnings for operating without registration | 143 | 82 |
TICO increased enforcement in 2024/2025, with a 74% rise in warnings for operating without registration — signalling a crackdown on unregistered operators selling travel services in Ontario.
Consumer Awareness and Travel Insurance
- 80% of Ontario respondents feel TICO is valuable — an all-time high (November 2024 survey)
- 75% of Ontarians aware of TICO prefer booking with a TICO-registered agency
- 72% of Ontarians travel 1-3 times per year
- Nearly half of surveyed consumers are likely to book with a travel agent
- 2 in 3 feel it is “critical” or “important” that their travel agency is regulated
- 2 in 3 are likely to purchase travel insurance and book with flexible cancellation policies
These figures underscore the growing consumer preference for regulated, protected travel purchasing — particularly for high-value bookings like cruise vacations, all-inclusive packages, and group travel. Phoenix Voyages is fully TICO-registered (registration #50028032), providing this protection to all clients.
Travel Advisor Industry Trends
The Role of Travel Advisors in 2025-2026
Despite the growth of online travel agencies to 43% of bookings, travel advisors remain essential for complex, high-value travel. Key findings from CLIA’s 2025 State of the Cruise Industry Report:
- Cruise travellers who book through a professional travel advisor report consistently higher Net Promoter Scores than those who book directly
- The primary driver for working with an advisor is knowledge and experience — particularly destination expertise and supplier relationships
- Friends and family recommendations are the single highest influence on a decision to cruise, followed by travel advisor guidance
- Advisors are particularly valued for group coordination, destination wedding logistics, and multi-generational family cruise planning
As an Ontario-based travel agency and member of Travel Leaders Network — one of North America’s largest travel agency organisations — Phoenix Voyages provides our independent travel advisors with access to exclusive deals, preferred supplier pricing, and the expertise that makes a measurable difference in travel outcomes.
Key Trends Shaping Canadian Travel in 2026
- Domestic travel surge: Canadian domestic spending rose 6.9% in summer 2025 as geopolitical tensions and tariff uncertainty redirected travel spend within Canada.
- Cruise industry growth: New-to-cruise passengers reached 31% in 2024, and solo cruising doubled. The industry is attracting younger, more diverse travellers.
- Luxury and expedition boom: Luxury fleet has tripled since 2010; expedition cruising grew 22% year-over-year. Demand for unique, experiential travel is accelerating.
- Consumer protection awareness: 80% of Ontario consumers value TICO — an all-time high. Booking through regulated agencies is increasingly seen as essential, not optional.
- Caribbean diversification: While traditional leaders (Dominican Republic, Cuba) face headwinds, emerging destinations like Barbados (+34.8% cruise growth), Grenada, and Bonaire are surging.
- Sustainability investment: 61% of the global cruise fleet is now shore-power equipped, and 50% of new capacity launching by 2028 will have LNG or methanol-capable engines.
Frequently Asked Questions
How big is Canada’s travel and tourism industry?
Canada’s travel and tourism industry generates approximately $130 billion in direct visitor spending annually, with a total economic footprint of $263 billion when indirect and induced effects are included. It supports 712,100 jobs and is the country’s second-largest service export. The market is projected to reach US$120.2 billion by 2031.
How many Canadians go on cruises each year?
Approximately 1.03 million Canadians took an ocean-going cruise in 2023, generating CA$5.2 billion in economic impact and supporting 24,000 jobs across Canada. Canadian cruisers are more likely to travel solo (13%) compared to the global average (10%), and 82% of those who have cruised plan to cruise again.
What is the most popular Caribbean cruise destination?
The Bahamas is the Caribbean’s busiest cruise destination, welcoming 10.6 million cruise passengers in 2025 through the Nassau Cruise Port. Other major cruise destinations include Jamaica (1.5 million), Turks & Caicos (1.1 million), and the British Virgin Islands (875,000). Barbados saw the fastest cruise growth in the region at 34.8% year-over-year.
How many travel agencies are registered with TICO in Ontario?
As of March 2025, there are 1,894 travel agencies and wholesalers registered with TICO. Of these, 86% (1,625) are retail travel agencies and 14% (269) are travel wholesalers. These registrants collectively generate approximately $18 billion in Ontario Gross Sales annually. TICO increased enforcement in 2024/2025, issuing 143 warnings for operating without registration — a 74% increase from the prior year.
Is the Canadian travel industry growing?
Yes. Canada’s tourism sector grew 1.3% in real GDP terms in Q2 2025, outpacing the broader economy (which contracted 0.2%). Summer 2025 set records with $58.96 billion in tourism revenue. The market is forecast to grow at approximately 4% annually through 2031. Cruise industry growth is even faster, with global passenger volumes projected to reach 42 million by 2028, up from 34.6 million in 2024.
Sources and Methodology
The statistics on this page are compiled from the following primary sources:
- Statistics Canada — National Tourism Indicators, quarterly (statcan.gc.ca)
- Destination Canada — Value of Tourism annual report and Tourism Outlook 2025-2030 (destinationcanada.com)
- Cruise Lines International Association (CLIA) — State of the Cruise Industry Report 2024 and 2025 (cruising.org)
- Travel Industry Council of Ontario (TICO) — Annual Report 2024-2025 and Consumer Survey Spring 2025 (tico.ca)
- Vancouver Fraser Port Authority — 2025 Cruise Season Report (portvancouver.com)
- Mordor Intelligence — Canada Travel and Tourism Market Size & Share Analysis 2026-2031
- Caribbean Tourism Organization (CTO) — 2025 regional arrival statistics
- Tourism Analytics — Caribbean destination performance data 2025 (tourismanalytics.com)
- Eastern Caribbean Central Bank (ECCB) — ECCU monthly tourism statistics
All dollar figures are in Canadian dollars unless otherwise noted. “Record” figures reference the highest reported values in each destination’s tracked history. Cruise passenger counts refer to ocean-going passengers unless specified.
Plan Your Canadian Travel Experience
Phoenix Voyages is a TICO-registered travel agency (registration #50028032) specialising in cruise vacations, Caribbean getaways, all-inclusive resorts, and group travel for Canadians. Our independent travel advisors provide the expert guidance and consumer protection that make the difference between a good trip and an exceptional one.
Get in touch: 1-855-383-5771 | info@phoenixvoyages.ca | Request a consultation
Explore more: Cruise Deals | Caribbean Cruises | All-Inclusive Vacations | Canadian Cruise Ports | TICO Protection Guide | Ontario Travel Agency
764274 Ontario Inc. o/a Phoenix Voyages | TICO #50028032 | 600 du Golf Rd., Hammond, ON K0A 2A0